 A stem and leaf plot is a numerical display of the distribution of a variable. The information is written to show that the last digit is the leaf and the rest of the numbers in front are the stem. The one above is just an example on how stem and leaf plots work. http://www.webquest.hawaii.edu/kahihi/mathdictionary/images/stem_leaf_graph1.gif
Steven McMahon: Map Catalog
Tuesday, November 19, 2013
Stem and leaf plot
 A stem and leaf plot is a numerical display of the distribution of a variable. The information is written to show that the last digit is the leaf and the rest of the numbers in front are the stem. The one above is just an example on how stem and leaf plots work. http://www.webquest.hawaii.edu/kahihi/mathdictionary/images/stem_leaf_graph1.gif
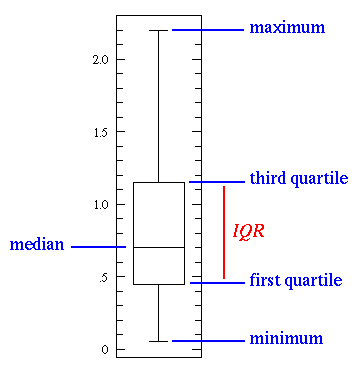
Box plot
Histogram
 A histogram is a diagram consisting of individual bars who has different values. The values are dependent on the y-axis and the x-axis. The y-axis determines how high the bars will rise, while the x-axis is what we are measuring. The map shows the hours of delay in traffic per major city. http://www.coolinfographics.com/blog/2010/2/9/city-population-shift-maps.html
Parallel coordinate graph
Triangular plot map
 A triangular plot map is a way to plot three different variables which have the same purpose. It shows the ratios of the three variables on an equilateral triangle. The picture shows how each corresponding major parties would win over majority in Parliament.
http://kelseyherritt.blogspot.com/2011/04/triangular-plot.html
Wind rose map
Sunday, November 17, 2013
climograph
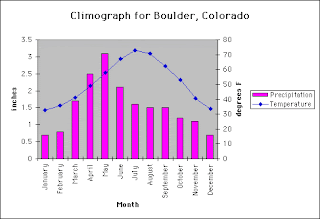
 This climograph is of the United States over a whole calendar year. A climograph is a graphical depiction of the monthly precipitation and temperature conditions for a selected place. This one shows the climograph of Boulder, Colorado.
http://www.colorado.edu/geography/extra/geogweb/manitousprings/intro/page2.html
Subscribe to:
Comments (Atom)


