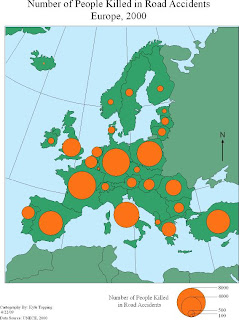
 Continuously variable proportional circle map portrays data is being depicted by using dots that are proportional in scale and location of the information being represented. In this map it shows a map of people killed in road accidents in Europe.
http://irvinecatalogs.blogspot.com/2011/07/range-graded-proportional-circle-map.html
No comments:
Post a Comment