 A stem and leaf plot is a numerical display of the distribution of a variable. The information is written to show that the last digit is the leaf and the rest of the numbers in front are the stem. The one above is just an example on how stem and leaf plots work. http://www.webquest.hawaii.edu/kahihi/mathdictionary/images/stem_leaf_graph1.gif
Tuesday, November 19, 2013
Stem and leaf plot
A stem and leaf plot is a numerical display of the distribution of a variable. The information is written to show that the last digit is the leaf and the rest of the numbers in front are the stem. The one above is just an example on how stem and leaf plots work. http://www.webquest.hawaii.edu/kahihi/mathdictionary/images/stem_leaf_graph1.gif
Box plot
Histogram
 A histogram is a diagram consisting of individual bars who has different values. The values are dependent on the y-axis and the x-axis. The y-axis determines how high the bars will rise, while the x-axis is what we are measuring. The map shows the hours of delay in traffic per major city. http://www.coolinfographics.com/blog/2010/2/9/city-population-shift-maps.html
Parallel coordinate graph

Triangular plot map
 A triangular plot map is a way to plot three different variables which have the same purpose. It shows the ratios of the three variables on an equilateral triangle. The picture shows how each corresponding major parties would win over majority in Parliament.
http://kelseyherritt.blogspot.com/2011/04/triangular-plot.html
A triangular plot map is a way to plot three different variables which have the same purpose. It shows the ratios of the three variables on an equilateral triangle. The picture shows how each corresponding major parties would win over majority in Parliament.
http://kelseyherritt.blogspot.com/2011/04/triangular-plot.html
Wind rose map

Sunday, November 17, 2013
climograph
 This climograph is of the United States over a whole calendar year. A climograph is a graphical depiction of the monthly precipitation and temperature conditions for a selected place. This one shows the climograph of Boulder, Colorado.
http://www.colorado.edu/geography/extra/geogweb/manitousprings/intro/page2.html
This climograph is of the United States over a whole calendar year. A climograph is a graphical depiction of the monthly precipitation and temperature conditions for a selected place. This one shows the climograph of Boulder, Colorado.
http://www.colorado.edu/geography/extra/geogweb/manitousprings/intro/page2.html
population profile
 Population profiles or population pyramids are commonly used to show the trends in population statistics over time. The first pyramid shows that Kenya has rapid growth. They have a very young population with high fertility rates and high death rates among their older population. http://albanesemapcatalog.blogspot.com/2011/04/population-profile.html
scatter plot
index value plot

Lorenz curve
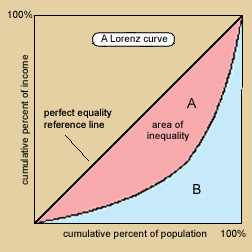 A Lorenz curve represents a probability distribution of statistical values, and often shows the degree of inequality that exists between two variables. For instance, in this Lorenz curve, the distribution of income is illustrated in reference to the percent of the population. http://mapanalysis.blogspot.com/2011/04/lorenz-curve.html
bilateral graph
 A bilateral graph displays two or more related sets of data on that same graph. This graph can be a line graph, bar graph, or some other type of graph. This map shows the comparison of two variables. It shows "Forced" Preference for Communism versus Fascism.
http://chasesmaps.blogspot.com/2010/11/bilateral-graph.html
A bilateral graph displays two or more related sets of data on that same graph. This graph can be a line graph, bar graph, or some other type of graph. This map shows the comparison of two variables. It shows "Forced" Preference for Communism versus Fascism.
http://chasesmaps.blogspot.com/2010/11/bilateral-graph.html
nominal area choropleth map
 A nominal area choropleth map is a thematic map that displays areal data. These maps use different colors or patterns to distinguish between certain areas or regions. The data that is represented is nominal data, meaning there is no ranking order for each category, so therefore a rainbow of different colors is many times used. This map shows the minority groups with highest percent of state population. http://tomsmapcatalog.blogspot.com/2010/04/nominal-area-choropleth-map.html
unstandarized choropleth map

Standarized choropleth map

Univariate choropleth map

bivariate choropleth map
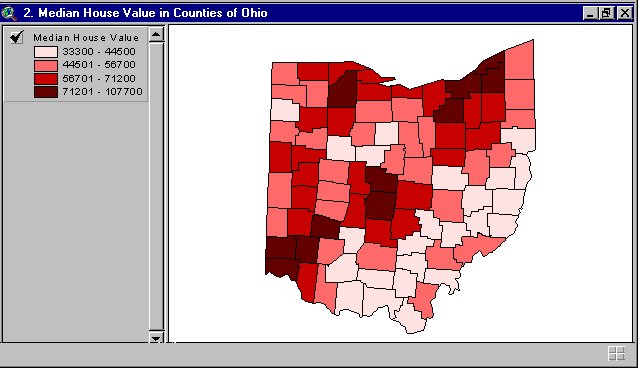 A bivariate choropleth map shows two variables on the same map. A bivariate map may consist of line features, polygon features, or point features. The map above is an bivariate map depicting the median house values in counties all over Ohio.
http://proceedings.esri.com/library/userconf/proc99/proceed/papers/pap171/p171.htm
A bivariate choropleth map shows two variables on the same map. A bivariate map may consist of line features, polygon features, or point features. The map above is an bivariate map depicting the median house values in counties all over Ohio.
http://proceedings.esri.com/library/userconf/proc99/proceed/papers/pap171/p171.htm
unclass choropleth map

Class Choropleth map

range graded proportional circle map

continuously variable proportional circle map
 Continuously variable proportional circle map portrays data is being depicted by using dots that are proportional in scale and location of the information being represented. In this map it shows a map of people killed in road accidents in Europe.
http://irvinecatalogs.blogspot.com/2011/07/range-graded-proportional-circle-map.html
Continuously variable proportional circle map portrays data is being depicted by using dots that are proportional in scale and location of the information being represented. In this map it shows a map of people killed in road accidents in Europe.
http://irvinecatalogs.blogspot.com/2011/07/range-graded-proportional-circle-map.html
DOQQ map

DEM map
 DEM,digital elevation model,is a map that shows a 3D map of the Earth's, or any surface, terrain. This map shows the terrain of Sturgis, South Dakota.
http://albanesemapcatalog.blogspot.com/2011_04_01_archive.html
DEM,digital elevation model,is a map that shows a 3D map of the Earth's, or any surface, terrain. This map shows the terrain of Sturgis, South Dakota.
http://albanesemapcatalog.blogspot.com/2011_04_01_archive.html
Subscribe to:
Comments (Atom)