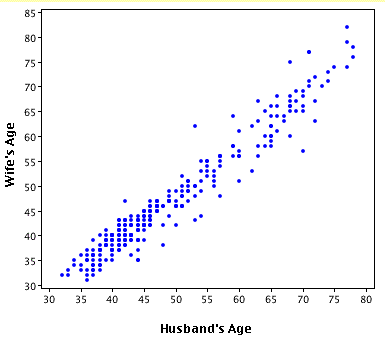
 Scatterplots are used to display two or more sets of data using cartesian points. Correlations are formed when you can see a pattern between the points. This scatter plot shows the correlation between the wife's age and the husband's age.
http://tb04fmapcatalog.blogspot.com/2011/04/scatterplot.html
Scatterplots are used to display two or more sets of data using cartesian points. Correlations are formed when you can see a pattern between the points. This scatter plot shows the correlation between the wife's age and the husband's age.
http://tb04fmapcatalog.blogspot.com/2011/04/scatterplot.html
Sunday, November 17, 2013
scatter plot
Scatterplots are used to display two or more sets of data using cartesian points. Correlations are formed when you can see a pattern between the points. This scatter plot shows the correlation between the wife's age and the husband's age.
http://tb04fmapcatalog.blogspot.com/2011/04/scatterplot.html
Subscribe to:
Post Comments (Atom)
No comments:
Post a Comment