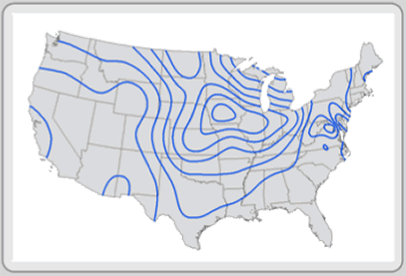
 Isoline maps are used to represent a three dimensional model on a two dimensional scale. This is done by connecting lines that represent the same value. This map shows the weather in the United States. As you can see there are lines across the map and those lines form circles. Each circle has a particular weather in that area, which isn't shown on this map.
http://giscommons.org/output/
No comments:
Post a Comment